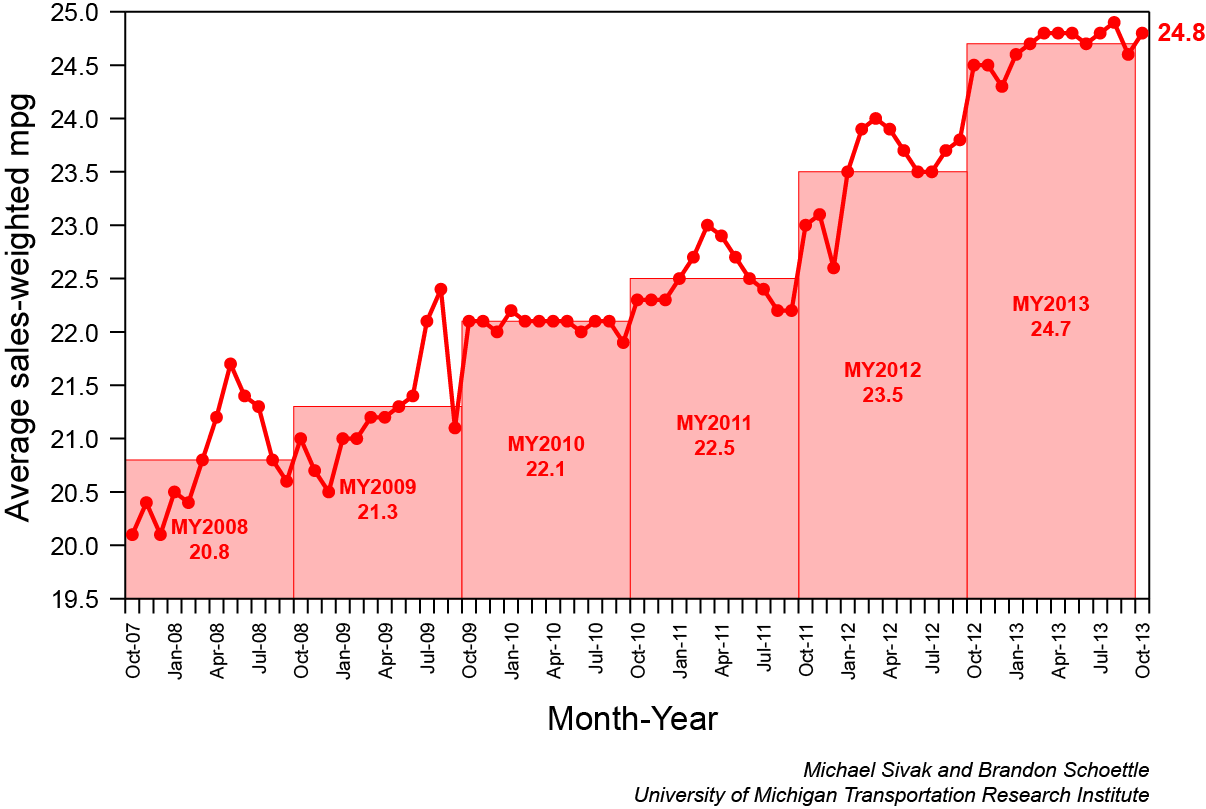
The average sales-weighted fuel economy was calculated from the monthly sales of individual models of light-duty vehicles (cars, SUVs, vans, and pickup trucks) and the combined city/highway fuel-economy ratings published in the EPA Fuel Economy Guide (i.e., window sticker ratings) for the respective models. For both monthly and model year averages, sales-weighted arithmetic means were calculated. (The arithmetic mean was used here to determine the average of window sticker ratings, not the average fuel consumption rate.) The bars in the graph show the average for each model year. Vehicles purchased from October 2007 through September 2008 were assumed to be model year 2008. Analogous assumptions were made for vehicles purchased in each following model year. The fuel-economy information was available for 99.8% of vehicles purchased.
For cases in which the EPA Fuel Economy Guide contained multiple fuel-economy ratings for a vehicle model, the average of these ratings was used (without regard to sales figures for each specific engine or vehicle-model variant). Additionally, when a vehicle model was sold during a particular model year but it is not listed in that year’s EPA Fuel Economy Guide, the fuel-economy rating(s) from the most recently available year were used. Finally, for very low sales-volume manufacturers (e.g., Ferrari, Rolls-Royce, etc.), all vehicle models for that manufacturer were aggregated and one average fuel-economy rating was calculated. Analogously, the sales figures for such manufacturers and models were also aggregated each month. (Data for recent months are occasionally updated in the underlying EPA data source, possibly resulting in small changes to recent fuel economy values.)
Latest data: October 2013.
Last updated: November 12, 2013.
(click on the graph to view full size)
![]() Download the current sales-weighted fuel-economy data (UMTRI_sales-weighted-MPG_October-2013.xls)
Download the current sales-weighted fuel-economy data (UMTRI_sales-weighted-MPG_October-2013.xls)
| Year | Month | |||||||||||
| Jan | Feb | Mar | Apr | May | Jun | Jul | Aug | Sep | Oct | Nov | Dec | |
| 2007 | 20.1 | 20.4 | 20.1 | |||||||||
| 2008 | 20.5 | 20.4 | 20.8 | 21.2 | 21.7 | 21.4 | 21.3 | 20.8 | 20.6 | 21.0 | 20.7 | 20.5 |
| 2009 | 21.0 | 21.0 | 21.2 | 21.2 | 21.3 | 21.4 | 22.1 | 22.4 | 21.1 | 22.1 | 22.1 | 22.0 |
| 2010 | 22.2 | 22.1 | 22.1 | 22.1 | 22.1 | 22.0 | 22.1 | 22.1 | 21.9 | 22.3 | 22.3 | 22.3 |
| 2011 | 22.5 | 22.7 | 23.0 | 22.9 | 22.7 | 22.5 | 22.4 | 22.2 | 22.2 | 23.0 | 23.1 | 22.6 |
| 2012 | 23.5 | 23.9 | 24.0 | 23.9 | 23.7 | 23.5 | 23.5 | 23.7 | 23.8 | 24.5 | 24.5 | 24.3 |
| 2013 | 24.6 | 24.7 | 24.8 | 24.8 | 24.8 | 24.7 | 24.8 | 24.9 | 24.6 | 24.8 | ||