TrueCar, Inc.’s (NASDAQ: TRUE) data and analytics subsidiary, ALG, projects total new vehicle sales will reach 1,268,141 units in February, down 2.6% from a year ago. This month’s seasonally adjusted annualized rate (SAAR) for total light vehicle sales is an estimated 16.6 million units for the month. Excluding fleet sales, U.S. retail deliveries of new cars and light trucks should decrease 2.6% from a year ago to 1,001,149 units, yet up 9.8% from last month.
“The U.S. economy remains robust on many fronts, such as unemployment rate and consumer confidence, keeping vehicle sales at a healthy pace,” said Oliver Strauss, Chief Economist for TrueCar’s ALG. “Record snow and rainfall across the country, including the west coast, plus anxieties over tax refund size and the potential for another government shutdown contributed to the year-over-year decline.”
Given the overall health of vehicle sales, ALG expects OEMs are pulling back on incentives while maintaining retail market share. Average incentive spending by automakers will reach an estimated $3,653 per vehicle in February down $30 or 0.8% from a year ago, and up 3.0% or $108 from January 2019.
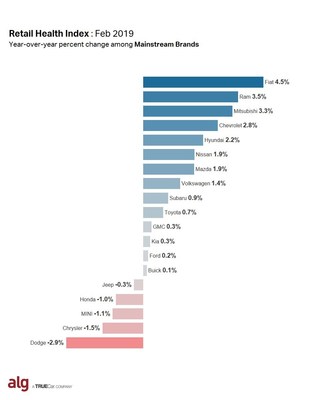
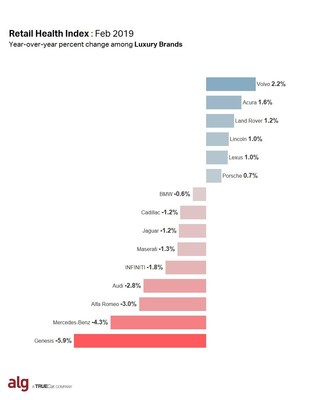
ALG also assessed automaker brand health with its Retail Health Index (RHI). RHI strips away the impact of price cuts to show which OEMs are growing retail share due to increased consumer demand versus which are “buying” share through higher incentives.
“Hyundai and Volvo are validating their ALG Redesign of the Year awards with strong performances expected in the Retail Health Index, driven by the all new Santa Fe and S60 respectively,” said Eric Lyman, Chief Industry Analyst for TrueCar’s ALG. “Both brands are in the midst of a product renaissance showcasing stylish designs in new segments, especially utilities, which continue to resonate with new vehicle shoppers.”
ALG also evaluates average transaction price (ATP) as an indicator for its Retail Health Index. For February, ALG estimates ATP for new light vehicles was $34,565, up 3.0% from a year ago while incentives as a percentage of ATP was at 10.6% down 3.7% year-over-year.
Retail Health Index (Forecast)
RHI measures the changes in retail market share relative to changes in incentive spending and transaction price to gauge whether OEMs are “buying” retail share through increased incentives, or whether share increases are largely demand-driven. An OEM with a positive RHI score is demonstrating a healthy balance of incentive spend relative to market share, either by holding incentive spending flat and increasing share or by increasing incentives with a higher positive increase in retail share.
| Forecasts for the 12 largest manufacturers by volume: | |||
| Total Unit Sales | |||
| Manufacturer | Feb
2019 Forecast |
Feb
2018 |
YoY % Change |
| BMW | 25,117 | 26,673 | -5.8% |
| Daimler | 25,675 | 27,894 | -8.0% |
| FCA | 164,528 | 166,834 | -1.4% |
| Ford | 188,215 | 193,362 | -2.7% |
| GM | 211,503 | 220,740 | -4.2% |
| Honda | 119,057 | 115,557 | 3.0% |
| Hyundai | 44,456 | 44,732 | -0.6% |
| Kia | 39,373 | 40,672 | -3.2% |
| Nissan | 111,058 | 129,930 | -14.5% |
| Subaru | 48,570 | 47,249 | 2.8% |
| Toyota | 175,290 | 182,195 | -3.8% |
| Volkswagen Group | 45,252 | 46,769 | -3.2% |
| Industry | 1,268,141 | 1,302,128 | -2.6% |
| Incentive Spending | |||
| Manufacturer | Incentive per Unit Feb 2019 Forecast |
Incentive per Unit %
Change vs. Feb 2018 |
Incentive per Unit % Change vs. Jan 2019 |
| BMW | $5,432 | -4.2% | 4.4% |
| Daimler | $6,031 | 26.6% | 3.2% |
| FCA | $4,524 | 4.1% | 3.7% |
| Ford | $4,139 | 1.7% | 2.8% |
| GM | $4,538 | -10.3% | 1.8% |
| Honda | $2,420 | 34.9% | 3.0% |
| Hyundai | $2,659 | -0.9% | 3.6% |
| Kia | $3,836 | 0.6% | 3.4% |
| Nissan | $3,980 | -4.3% | 1.7% |
| Subaru | $1,353 | 10.9% | 3.2% |
| Toyota | $2,464 | 0.4% | 3.4% |
| Volkswagen Group | $3,727 | 2.6% | 4.8% |
| Industry | $3,653 | -0.8% | 3.0% |
| Average Transaction Price (ATP) | |||||
| Manufacturer | Feb 2019 Forecast |
Feb 2018 | Jan 2019 | YOY % change |
MOM % change |
| BMW | $56,394 | $52,486 | $55,206 | 7.4% | 2.2% |
| Daimler | $65,901 | $61,609 | $62,182 | 7.0% | 6.0% |
| FCA | $35,910 | $34,406 | $35,843 | 4.4% | 0.2% |
| Ford | $38,482 | $37,230 | $38,781 | 3.4% | -0.8% |
| GM | $37,454 | $36,192 | $36,927 | 3.5% | 1.4% |
| Honda | $28,576 | $28,082 | $28,336 | 1.8% | 0.8% |
| Hyundai | $23,366 | $22,818 | $23,432 | 2.4% | -0.3% |
| Kia | $22,560 | $23,163 | $22,746 | -2.6% | -0.8% |
| Nissan | $27,458 | $27,766 | $28,096 | -1.1% | -2.3% |
| Subaru | $29,339 | $27,905 | $29,061 | 5.1% | 1.0% |
| Toyota | $32,536 | $32,033 | $32,279 | 1.6% | 0.8% |
| Volkswagen Group | $38,092 | $35,823 | $37,720 | 6.3% | 1.0% |
| Industry | $34,565 | $33,552 | $34,318 | 3.0% | 0.7% |
For additional data visit the ALG Newsroom.
(Note: This forecast is based solely on TrueCar’s analysis of industry sales trends and conditions and is not a projection of the company’s operations.)
SOURCE: TrueCar
