Mobility may be the buzzword of the moment, but it does not describe a new problem. Cities have long had to adapt to the demands of urbanisation, and rural areas have always been widely underserved. It is also well understood that urban mobility varies from city to city, and new research has highlighted just how significant those differences are.
Location intelligence specialist HERE Technologies—perhaps best known for its mapping services—recently launched the Urban Mobility Index, a deep dive into the factors that contribute to the mobility of nearly 40 cities worldwide. The idea was not only to compare the quality of mobility across different cities, but also to develop more of a quantitative definition for ‘mobility’ as a concept. “We wanted to get a more systematic grip on defining mobility,” says Christof Hellmis, Head of Services, Strategy and Innovation at HERE. “It’s such a broad term.”
Since the study’s release, HERE has engaged with the stakeholders involved—governments, city authorities, tech developers and automotive players—to see how the results may inform city planning. The company believes that location data can improve the decision-making process on a number of fronts, be it the way traffic is routed around a city or the scheduling of public transit services. Staying mobile, the index says, will be “crucial to a city’s liveability and economic prosperity. The smart cities of the future will be those who use location intelligent data to achieve this.”
Ideally, location data will indicate how a city may need to invest for the future mobility needs of its citizens. Four key performance indicators for urban mobility have been identified: connectivity, affordability, sustainability and innovation. The majority of cities in the study are in Europe and North America, accounting for 31 altogether. The remaining seven cities are in Asia Pacific and South America, including Melbourne, Mumbai, Singapore, Buenos Aires and Sao Paulo.
As can be expected, the quality of mobility differs greatly from city to city. Distinct regional trends are also apparent. “A key takeaway is that, based on their geography and culture, different cities operate in a different context,” Hellmis explains. “Western European countries are becoming more conscious of alternative mobility solutions, whereas in North America cities gravitate more towards the car—it’s all about the infrastructure.”
The cost of mobility
The index investigated how expensive it is to run a car or pay for public transport on a monthly basis, relative to the average wages for that city.
The US cities—San Francisco, Washington, D.C., New York City, Dallas, Houston, Chicago, Seattle and Los Angeles—all sit in the top ten highest monthly fuel expenses. In short, drivers in these cities spend a significant portion of their earnings on fuel each month. “It’s clear to see that some cities are ‘car cities’,” said Hellmis.
San Francisco, the city with the highest relative monthly fuel expense, also has the third lowest public transport expense (1.66% of monthly income). Even where public transport is less expensive, it seems that many will happily pay more to drive a car.
The two Brazilian cities studied are well known for traffic jams. Rio de Janeiro, the city with the lowest monthly fuel expenses, has the second highest public transit expenses (11.65% of monthly income). Sao Paulo, the leader in this respect (13.77%) also has the second lowest relative fuel cost. Cheap fuel and high public transit costs are doing little to dissuade locals from driving in the city.
Compared to the other 37 cities studied, Mumbai is somewhat unique: the cost of monthly public transportation is exceptionally low—just 0.9% of monthly earnings—but monthly fuel expenses are also the fourth lowest. While train and bus tickets may come cheap, this does not necessarily equate to a high quality of mobility. Public transport is hugely overcrowded and leads many locals to hitch a ride with a friend, walk or not travel at all. Drivers may have cheap fuel, but chronic traffic congestion is the price to pay.
EV charging
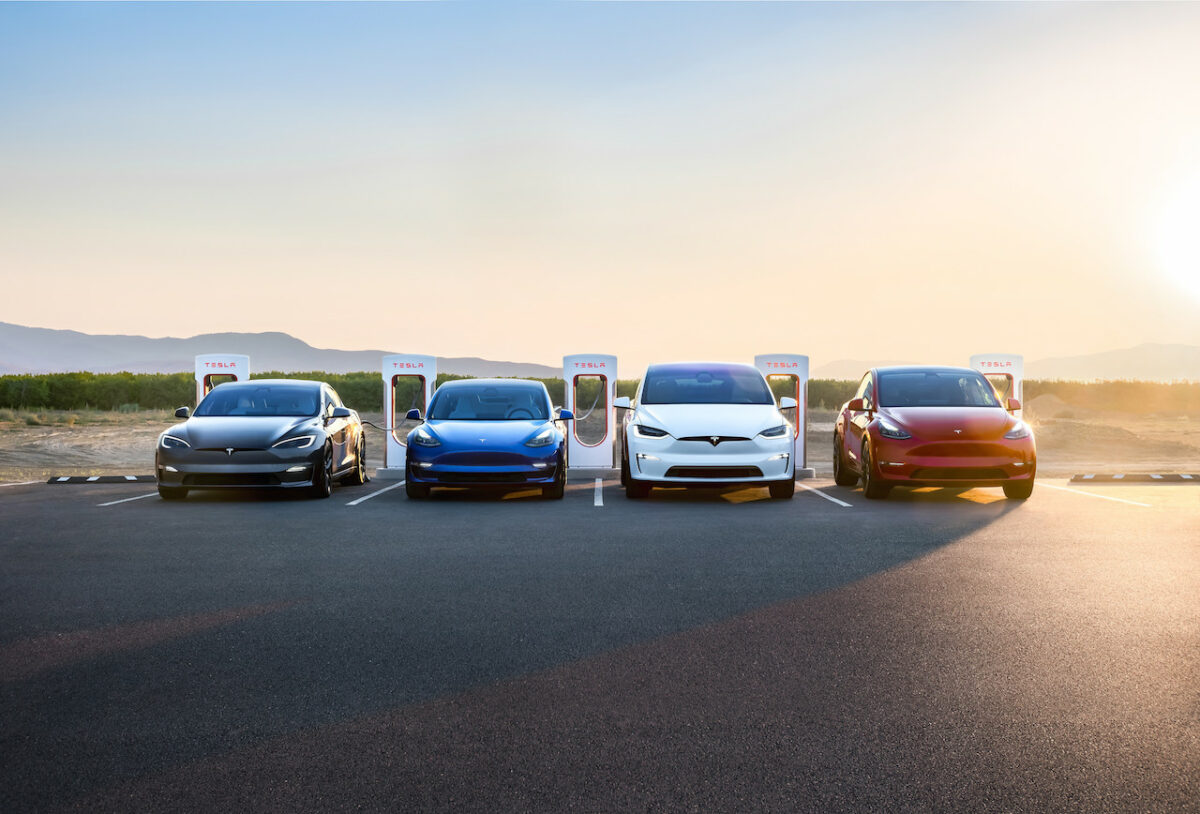
As urbanisation continues, existing measures to manage the travel patterns and requirements of a city may no longer cut it. With this in mind, HERE investigated how new technologies and business models are being adopted. The metrics include EV charging station density per million citizens, the level of automated rail networks, and the number of ‘docked’ city bicycles per 1000 people.
Amsterdam has built an almost unassailable lead from an e-mobility standpoint, with a staggering 1629 EV charging stations. The next closest, Paris, has just 554 by comparison. Of the North American cities studied, San Francisco and Seattle lead with 314 and 310 stations respectively; Toronto and New York City lag with just 44 and 43 stations per million citizens.
Sao Paulo and Mexico City both have zero charging stations per million people, but that does not tell the full story: stations are dotted sporadically, and it is this lack of density that leaves most locals underserved. The main highway that connects Sao Paulo with Rio de Janeiro, in particular, was recently kitted out with a handful of charge points, so progress is being made.
Bikes and trains
Somewhat surprisingly, Amsterdam sits mid-table in terms of the number of docked city bicycles per 1000 people (1.98 bikes), although this may be influenced by that fact that many residents own their own. Brussels leads with 4.17 docked bikes available per 1000 residents, with Singapore lagging with zero docked bikes per 1000 residents.
While Amsterdam may lead in two cornerstones to the future mobility campaign, it sits toward the bottom of the table from an automated metro rail perspective. Interestingly, there is no discernable trend here: other cities adjudged to have 0% rail automation include San Francisco, Rio de Janeiro, Mumbai, Dallas, Moscow, Madrid and Chicago to name but a few.
At the other end of the leader board, Vancouver and Copenhagen both boast 100% metro rail automation. Vancouver’s SkyTrain is a 50-mile network of both underground and elevated tracks, and is the world’s longest single automated rapid transit system; the Copenhagen Metro is around 13 miles long and operates 24 hours a day. In combination, Singapore has a greater length of automated metro rail—51 miles—but as a proportion of its entire metro network the city sits in second place with 55% overall automation.
The city as a system
The research generates some fairly simple conclusions. Today, certain cities are predisposed as car-centric, while others show a clear preference for public transportation. In addition, it is clear to see how highly e-mobility ranks on a city’s interests, so too with automated public transport and shared cycling schemes.
“We now have a better understanding of how these cities operate, and that they all have certain characteristics,” said Hellmis. “In general, cities with a high level of mobility offer a good mix of different elements; cities like Amsterdam have great public transit, yet they also favour electric mobility with a high density of charging stations.”
What is less clear is how connected, autonomous, shared and electric (CASE) technologies may make a difference. For example, can it be assumed that a city which has spent years developing a fully automated metro system will also favour fleets of automated road vehicles? If the public transportation network is efficient and cheap, will cities see any need to offer shared mobility schemes? And if bans are in place for diesel and gasoline vehicles, should the city invest in EV charging infrastructure or simply encourage the use of shared bicycles, e-scooters and other micro-mobility alternatives?
Ultimately, suggests Hellmis, cities need to take a holistic approach and move away from being pigeonholed to one category. “Solving mobility is ultimately a system task,” he explains. “There should not be one single solution that dominates, so we need to address all of them in a proper way to come out strong in the advancement of mobility.”
This article appeared in the Q4 2019 issue of M:bility | Magazine. Follow this link to download the full issue.


